FIRE MAPS
Large scale maps of fires and fire effects are constructed from composite satellite images. Satellite images of fires provide scientists with information about the extent and density of seasonal fires. Compiling this information into scientific maps allows scientists to evaluate the potential impact of fire on the global atmosphere and climate. |
Click below to see the fire maps and information:
Global fires
Air particles
GLOBAL FIRES
Click on the image to return to the gallery
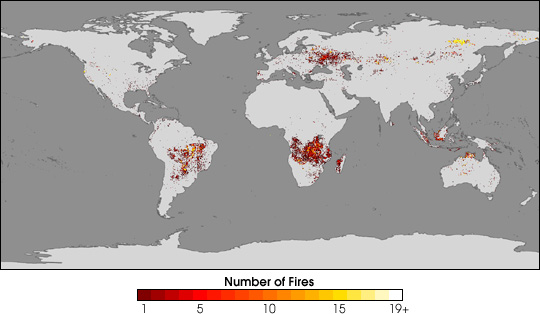
This map derived from satellite data shows fire activity across the globe for a week during August 2002. Scientists call this map "a milestone in the use of satellite data for creating a long-term fire record that is crucial for understanding the impact of fire on life and climate." The image was compiled from data provided by the Moderate Resolution Imaging Spectroradiometer (MODIS) on NASA's Terra satellite. The map demonstrates that during the period of observation, fire activity is generally restricted to a few areas, and is most intense in central Africa. According to scientists, "...the widespread fires that burn each year in the savannas of Africa, Australia, and Brazil dwarf even the most significant fire season in the western United States..." |
AIR PARTICLES
Click image to return to gallery
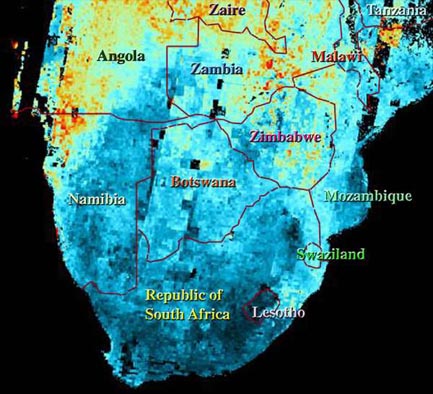
This image maps airborne particles over Southern Africa during August to September 2000. Blue represents low concentrations of particles and red represents high concentrations. The image was generated from a composite of images acquired with MISR technology aboard the Terra satellite. The smoke results mainly from burning grassland and secondary forest for agriculture and land management (e.g., to provide forage for herd animals). |


